Debugging
Errors are a common occurrence when writing code. It is unusual to write a substantial amount of code without encountering any errors. Fortunately, dealing with and resolving errors is a routine part of the development process.
In the Qodly development environment, you have access to a range of debugging tools to help you tackle different types of errors effectively.
Starting a debug session
To execute your code line-by-line and evaluate expressions, you must initiate a debug session on the server and attach it to your browser. Follow these steps:
-
Click the Debug button located in Qodly Studio toolbar.

-
If the debug session starts successfully, a green bullet will appear on the button label.

-
Once you begin executing code within the debug session, the bullet will turn orange.

You can only have one active debug session per instance. If another instance of the application has an active debug session (e.g., started from another browser), the debug button will display a warning message.
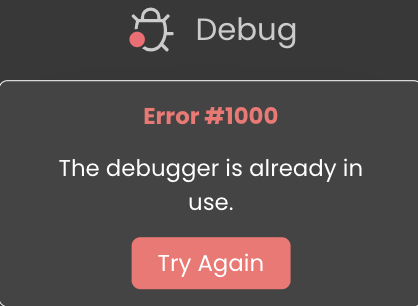
In such cases, you must wait until the other debug session is closed before starting a new one.
Verify that the method or function with the breakpoint is saved and not in draft state for the breakpoint to take effect during debugging.
Stopping a debug session
If you wish to stop a debug session, follow these steps:
-
Click the Debug button in Qodly Studio toolbar while a debug session is active.
-
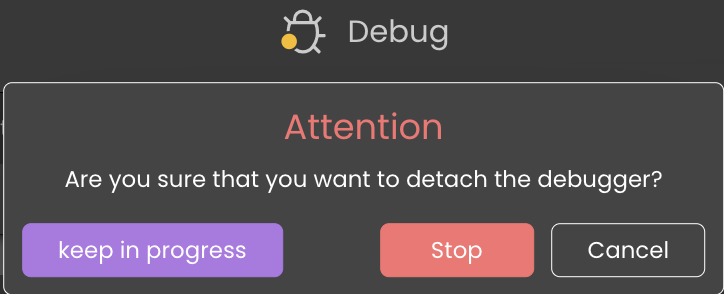
A warning dialog box will prompt you to confirm whether you want to detach the debugger, effectively closing the debug session attached to your browser. You will have several options:
- Keep in progress: Qodly will continue evaluating the code until the end of the current method or function, and then the debugger will be detached.
- Stop: The debugger will be immediately detached.
- Cancel: The debugger will not be detached.
Breakpoints
Breakpoints allow you to pause code execution at specific points in your code. You can set breakpoints on any line of code where you want the execution to halt. Here's how to create a breakpoint:
-
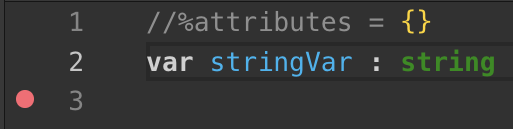
Click in the left margin of the code editor. This action will display a red bullet.
-
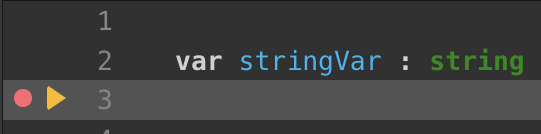
When you launch the code, a yellow arrow will appear in the left margin to indicate where the execution paused and mark the next line to be executed.
-
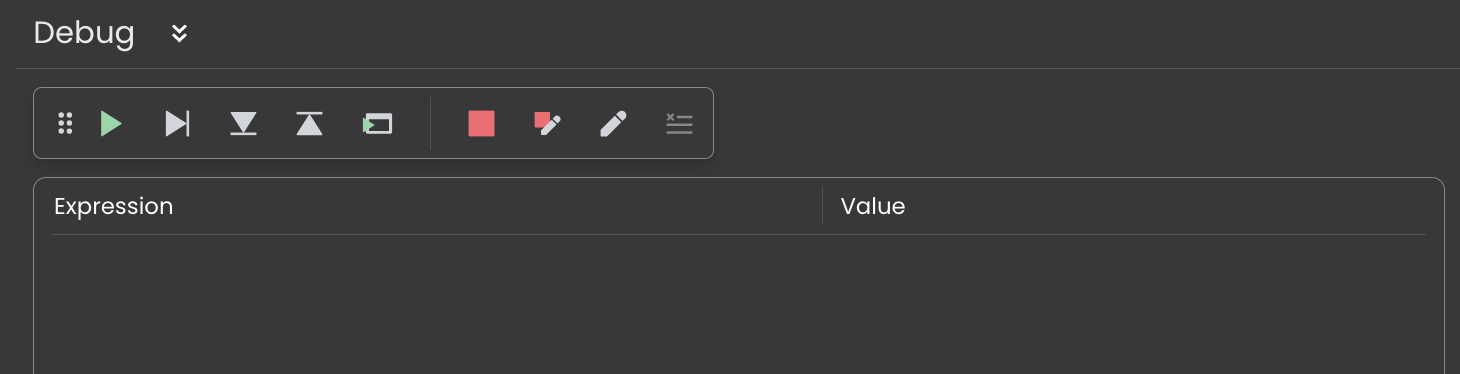
At this point, you can use the debugger panel at the bottom of the window to evaluate and debug your code.
Should a function appear unexpectedly, even without any breakpoints in your code while the debugger is active, it implies the existence of an error within that specific code section.
Breakpoint Status
Breakpoints can have different statuses depending on the context, which are represented by their appearance and tip:
| Appearance | Status | Context |
|---|---|---|
 | Breakpoint | The breakpoint is validated in the debug session and will pause code execution as expected. |
 | Draft breakpoint | The method or function where the breakpoint is set has not been correctly saved. Please ensure you save your changes first for the breakpoint to be validated and take effect. |
 | Unverified breakpoint | The breakpoint is saved, but no debug session is currently active. It will not pause code execution until a debug session is started. |
 | Disabled breakpoint | The breakpoint has been manually disabled. It remains visible but will not interrupt code execution until re-enabled. |
Debugger Sidebar
The Debugger Sidebar provides a centralized interface to monitor and manage all breakpoints across an application. It is designed to give developers full visibility into their active, disabled, or grouped breakpoints—regardless of which file or method they belong to.
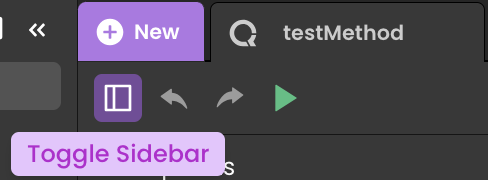
You can open the Debugger Sidebar from the left-hand panel in the code editor:
- Open Qodly Studio.
- In the code editor, look for the vertical tab on the left side.
- Click the sidebar icon to open the Debugger Sidebar
You can interact with all breakpoints even if they’re in different files — no need to open each one manually. The Breakpoints Sidebar saves time and helps you stay focused when debugging large apps.
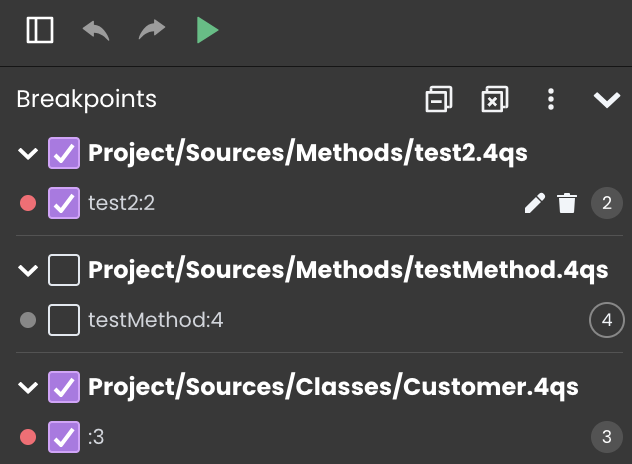
Sidebar Structure
The Breakpoints Sidebar displays all breakpoints grouped by file path and method or class name. For each breakpoint, the following information and actions are available:
- Breakpoint label: Indicates the method or class and line number where the breakpoint is defined.
- Status checkbox: Marks whether the breakpoint is currently active or disabled.
- Line number: Shown on the right to indicate the exact position within the code.
- Action icons: Provide quick access to delete, or navigate to a breakpoint once you hover over a breakpoint.
For more information, please refer to the Managing Breakpoints section.
Variables Panel
During a debug session, the debugger sidebar also includes a Variables section. This panel helps you inspect the state of your code at any given moment by displaying:
-
Local Variables: Displays all variables that are currently in scope within the method or class being executed. This includes any variables you've defined inside that function or block of code.
-
Current Line Variable: Highlights the specific variable being accessed or modified on the line of code currently being executed.
-
Arguments: Lists the arguments passed into the method, function, or class. These represent the input values the current code is working with, as provided by the calling context.
This makes it easier to understand the current context, trace issues, and test assumptions while stepping through your code.
Managing Breakpoints
Breakpoint Activation
Each breakpoint is associated with an activation checkbox:
- When the checkbox is selected
 , the breakpoint is active and will interrupt code execution during a debug session.
 - When the checkbox is cleared
 , the breakpoint remains listed but is temporarily disabled.
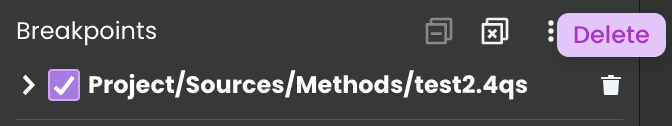
To manage breakpoints in bulk, a "Disable All" button 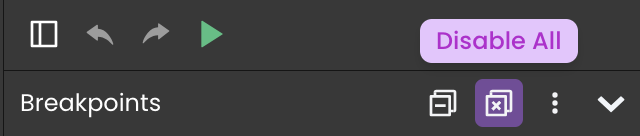 is available at the top of the panel, allowing all breakpoints across the app to be disabled simultaneously without deletion.
Breakpoint Deletion
Breakpoints can be removed individually or in groups:
-
The trash icon beside a specific breakpoint
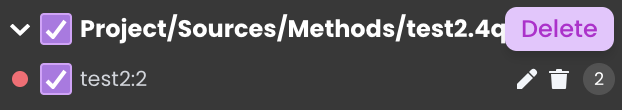 removes only that breakpoint.
 -
The trash icon beside a method or class header
 removes all breakpoints defined within that method or class.
 -
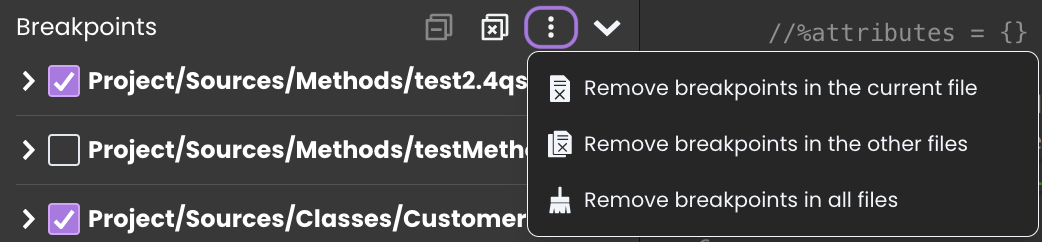
An overflow menu (⋮) provides additional bulk removal options:
- Remove Breakpoints in the Current File: Clears all breakpoints from your active file.
- Remove Breakpoints in Other Files: Removes all breakpoints from non-active files.
- Remove Breakpoints in All Files: Eliminates all breakpoints across the entire project.
- Remove Breakpoints in the Current File: Clears all breakpoints from your active file.
Breakpoint Navigation
Each breakpoint entry includes an edit icon 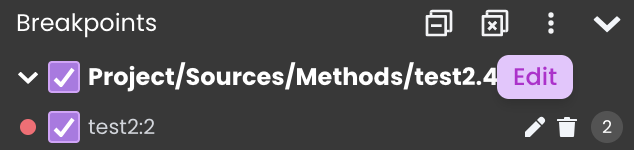 that enables direct navigation to the corresponding line in the code editor. This function supports fast inspection or modification of the code surrounding the breakpoint location.
Collapse/Expand Groups
To improve readability when working with a large number of breakpoints, the sidebar includes a "Collapse All" button 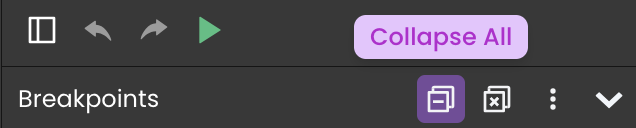 . This feature collapses all method or class sections, minimizing the visual footprint of the list and helping developers focus only on relevant groups.