Qodly Looker Studio Connector
Overview
The Qodly Looker Studio Connector enables seamless integration between your Qodly application and Google Looker Studio, a powerful data visualization tool. This allows you to create interactive dashboards, track real-time business metrics, and generate custom reports using your Qodly application data.
Why Use Looker Studio?
Understanding and analyzing your data is essential for making informed decisions. With this connector, you can:
-
Visualize and analyze your Qodly data in a user-friendly interface.
-
Monitor business performance using interactive charts and graphs.
-
Combine Qodly data with other sources for a comprehensive view.
-
Enable real-time insights with automatic data syncing and caching.
-
Embed reports into your Qodly application for seamless access.
How Does It Work?
The Qodly Looker Studio Connector acts as a bridge between your Qodly application and Looker Studio, pulling structured data from Qodly’s REST API and making it available for visualization in Looker Studio.
The integration process consists of:
-
Authenticating your Qodly app using an API key.
-
Defining the data classes and relationships in Qodly.
-
Configuring Looker Studio to retrieve and display Qodly data.
-
Building reports that provide valuable business insights.
-
Embedding reports within your Qodly application.
By structuring your data effectively, you ensure that Looker Studio presents accurate and meaningful visualizations.
Setting Up the Qodly Looker Studio Connector
Structuring Your Data in Qodly
If you already have existing data in Qodly, you can skip this section and move to the next step on connecting Qodly to Looker Studio. However, for the purpose of this guide, we will go through the step-by-step process of structuring the data for testing and demonstration.
Below is the data model that we will use in Qodly:
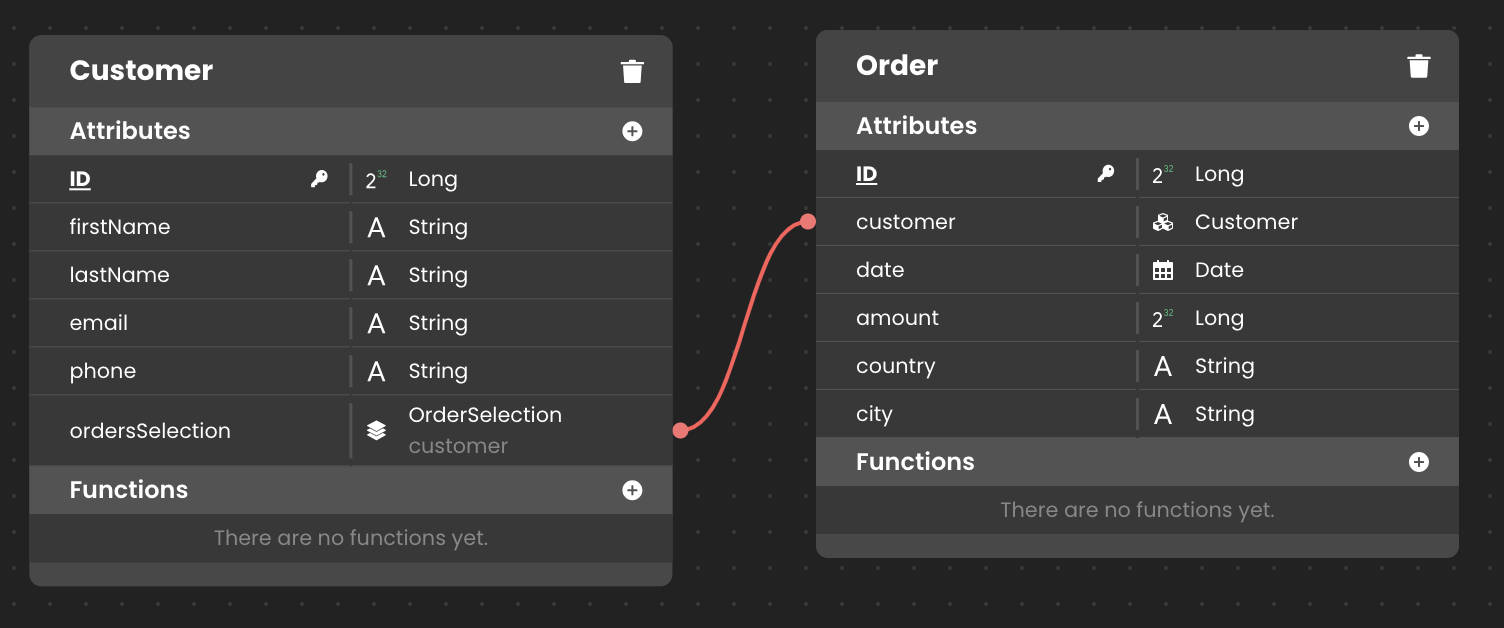
This model consists of two key data classes:
- Customer: Stores basic customer details.
- Order: Stores order details, including the country and city where the order was placed.
Each Customer can have multiple Orders, and an Order is not necessarily placed in the customer's home country. Customers may travel and place orders from different locations, making it important to analyze where orders are being placed rather than just where customers are from.
Connecting Qodly to Looker Studio
Step 1: Generate API Credentials in Qodly
To allow Looker Studio to access your Qodly data, you need an API endpoint and API key. These credentials act as authentication tokens that ensure secure access to your data.
-
Access the Qodly Console:
- Open the Qodly Console from your browser.
- Navigate to the API Keys section in the settings menu.
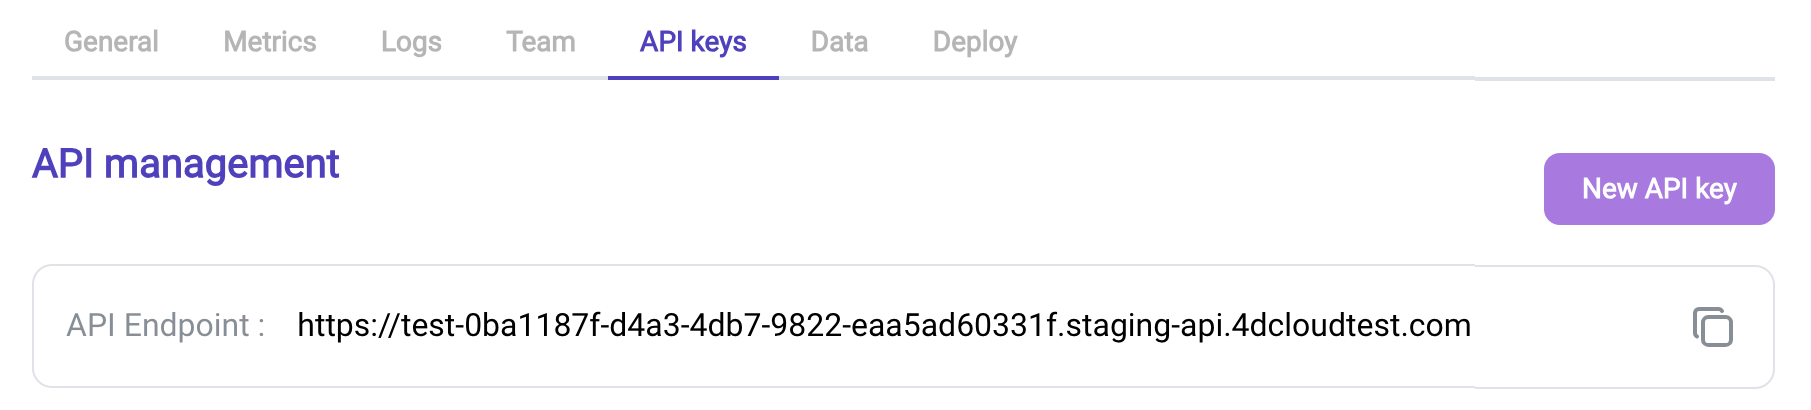
-
Retrieve the API Endpoint:
- The API Endpoint is a URL that Looker Studio will use to request data from your Qodly app.
- Copy this URL and store it somewhere accessible, as you will need it in the next step.
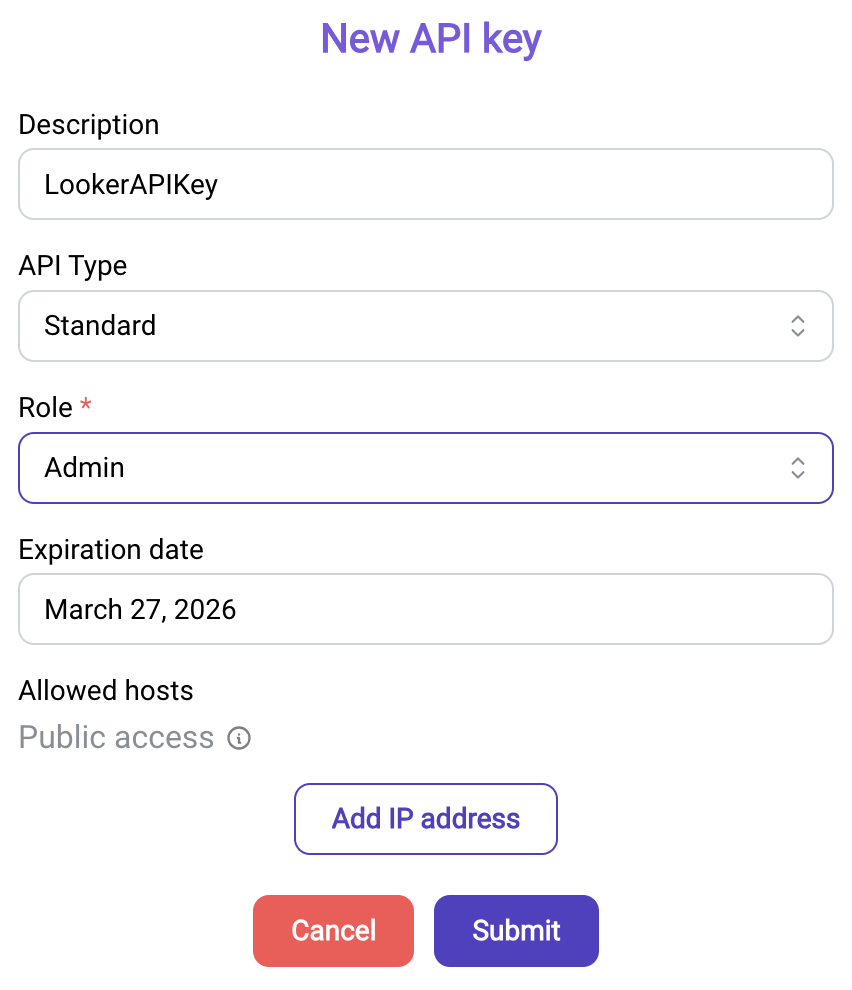
-
Create a New API Key:
- Click the "New API Key" button.
- Enter a descriptive name, such as "Looker API Key", to help you identify it.
- Set the type to Standard, which provides the necessary permissions for data access.
- Assign the Admin role to ensure that Looker Studio has the proper authorization to read data.
- Click Submit and copy the API key.
Step 2: Connect Qodly to Looker Studio
With the API credentials ready, you can now establish the connection in Looker Studio.
-
Open Looker Studio:
- Navigate to Google Looker Studio.
- Sign in with your Google account if prompted.
-
Create a New Report:
- If you're new to Looker Studio, click the Create button
 on the left sidebar and select Blank Report.
 - If you've used Looker Studio before, you'll see a large plus (+) button in the center of your dashboard labeled Blank Report
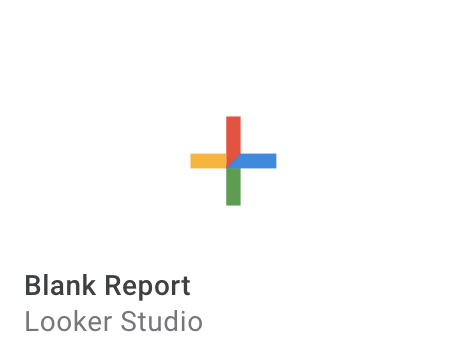 , click that to begin.
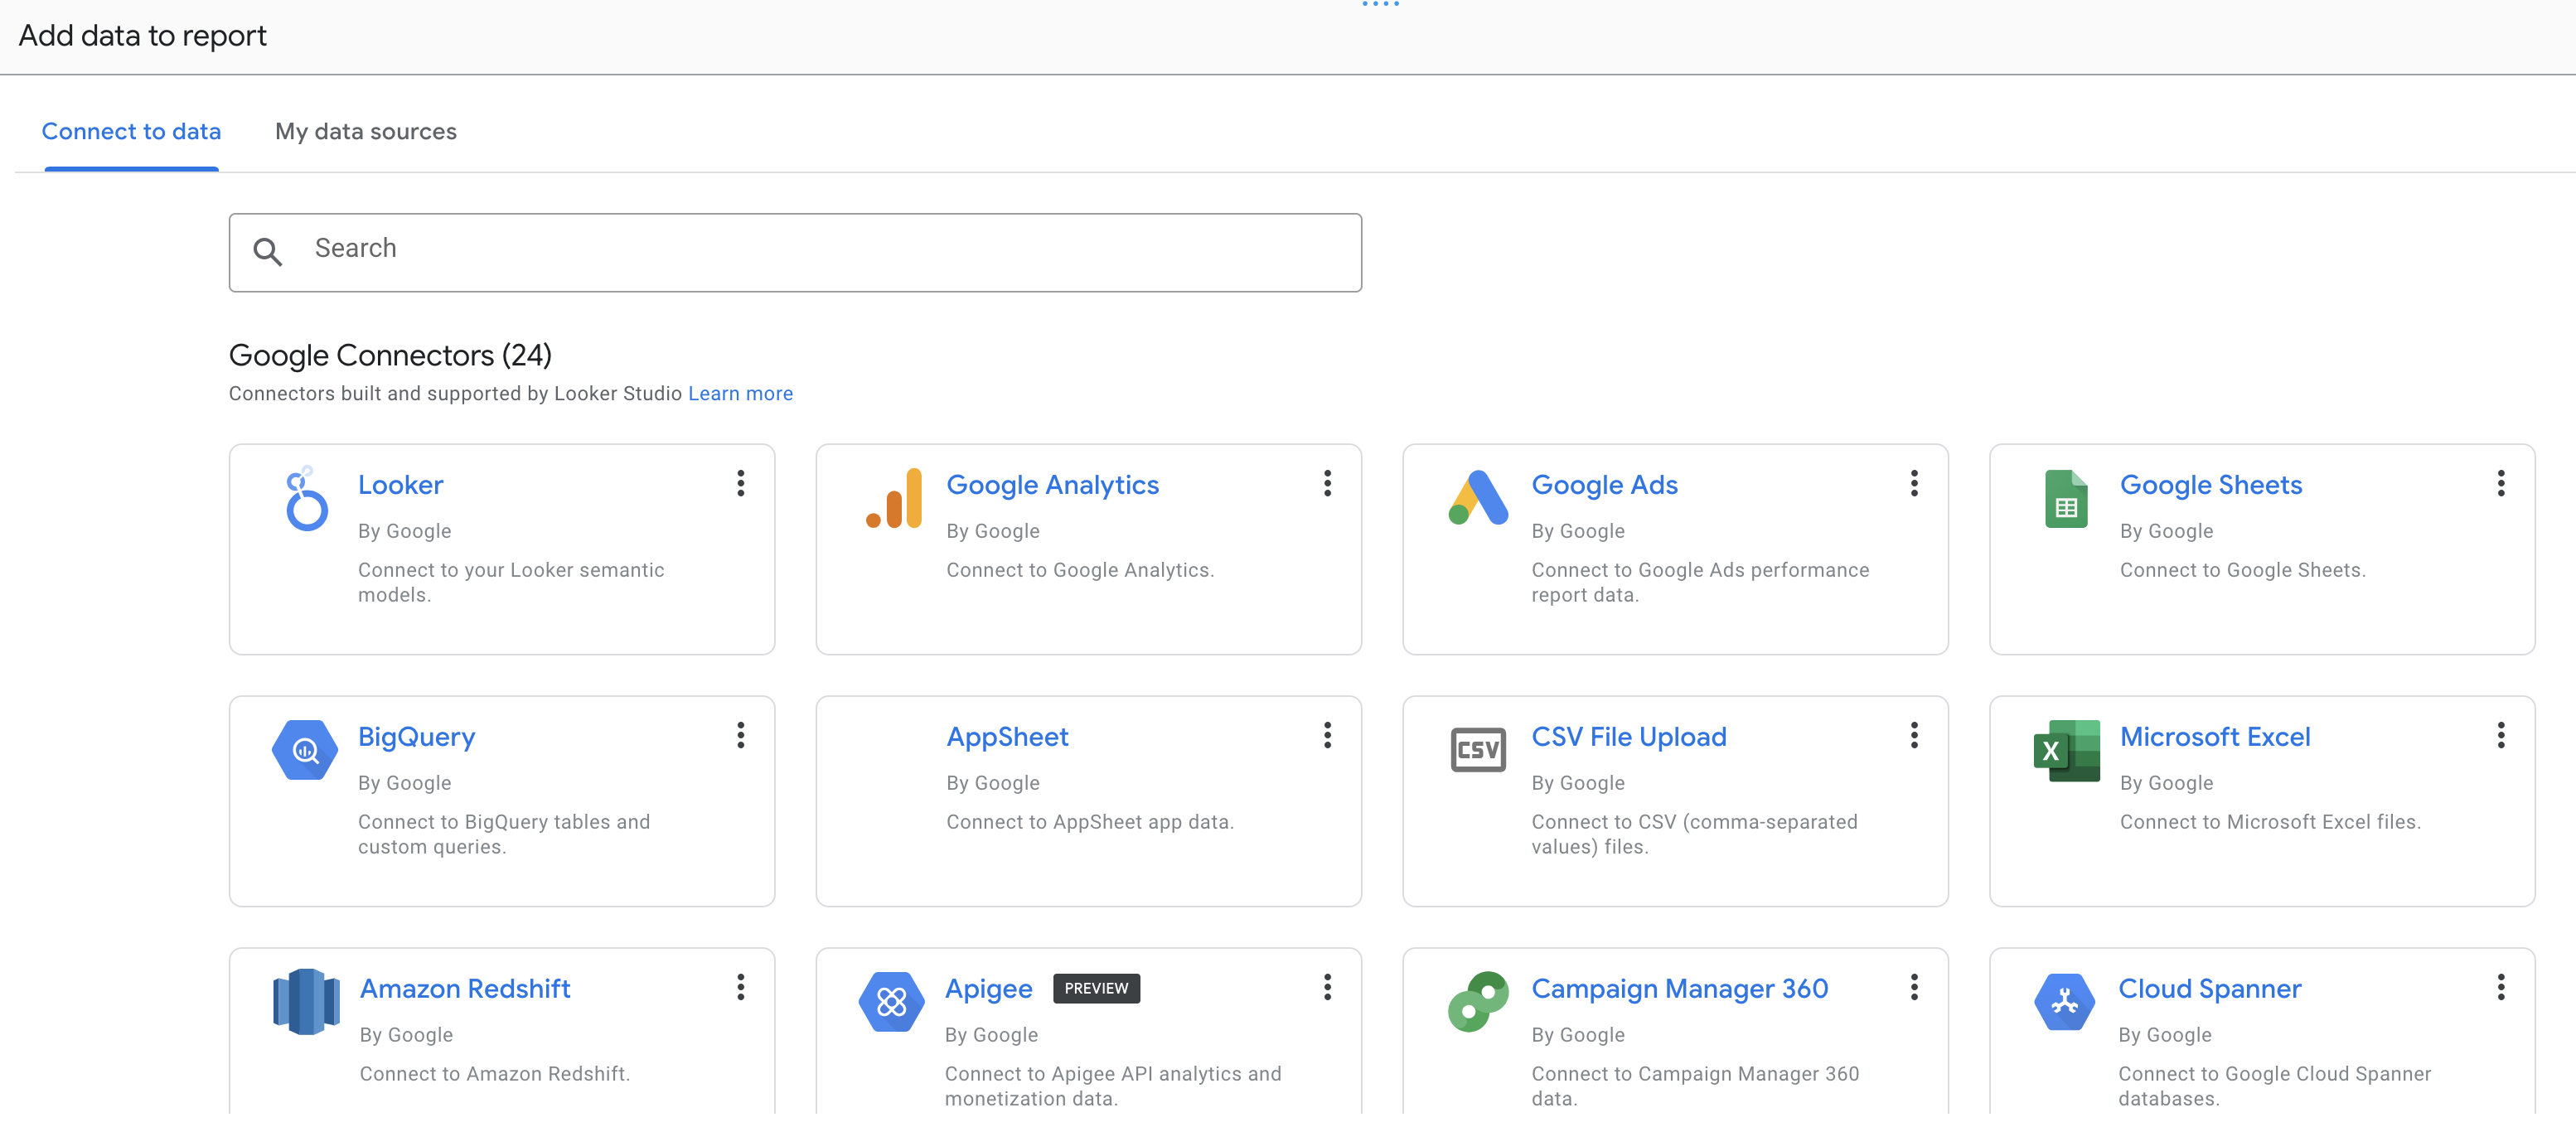
 - Looker Studio will then prompt you to add data to report.
- If you're new to Looker Studio, click the Create button
-
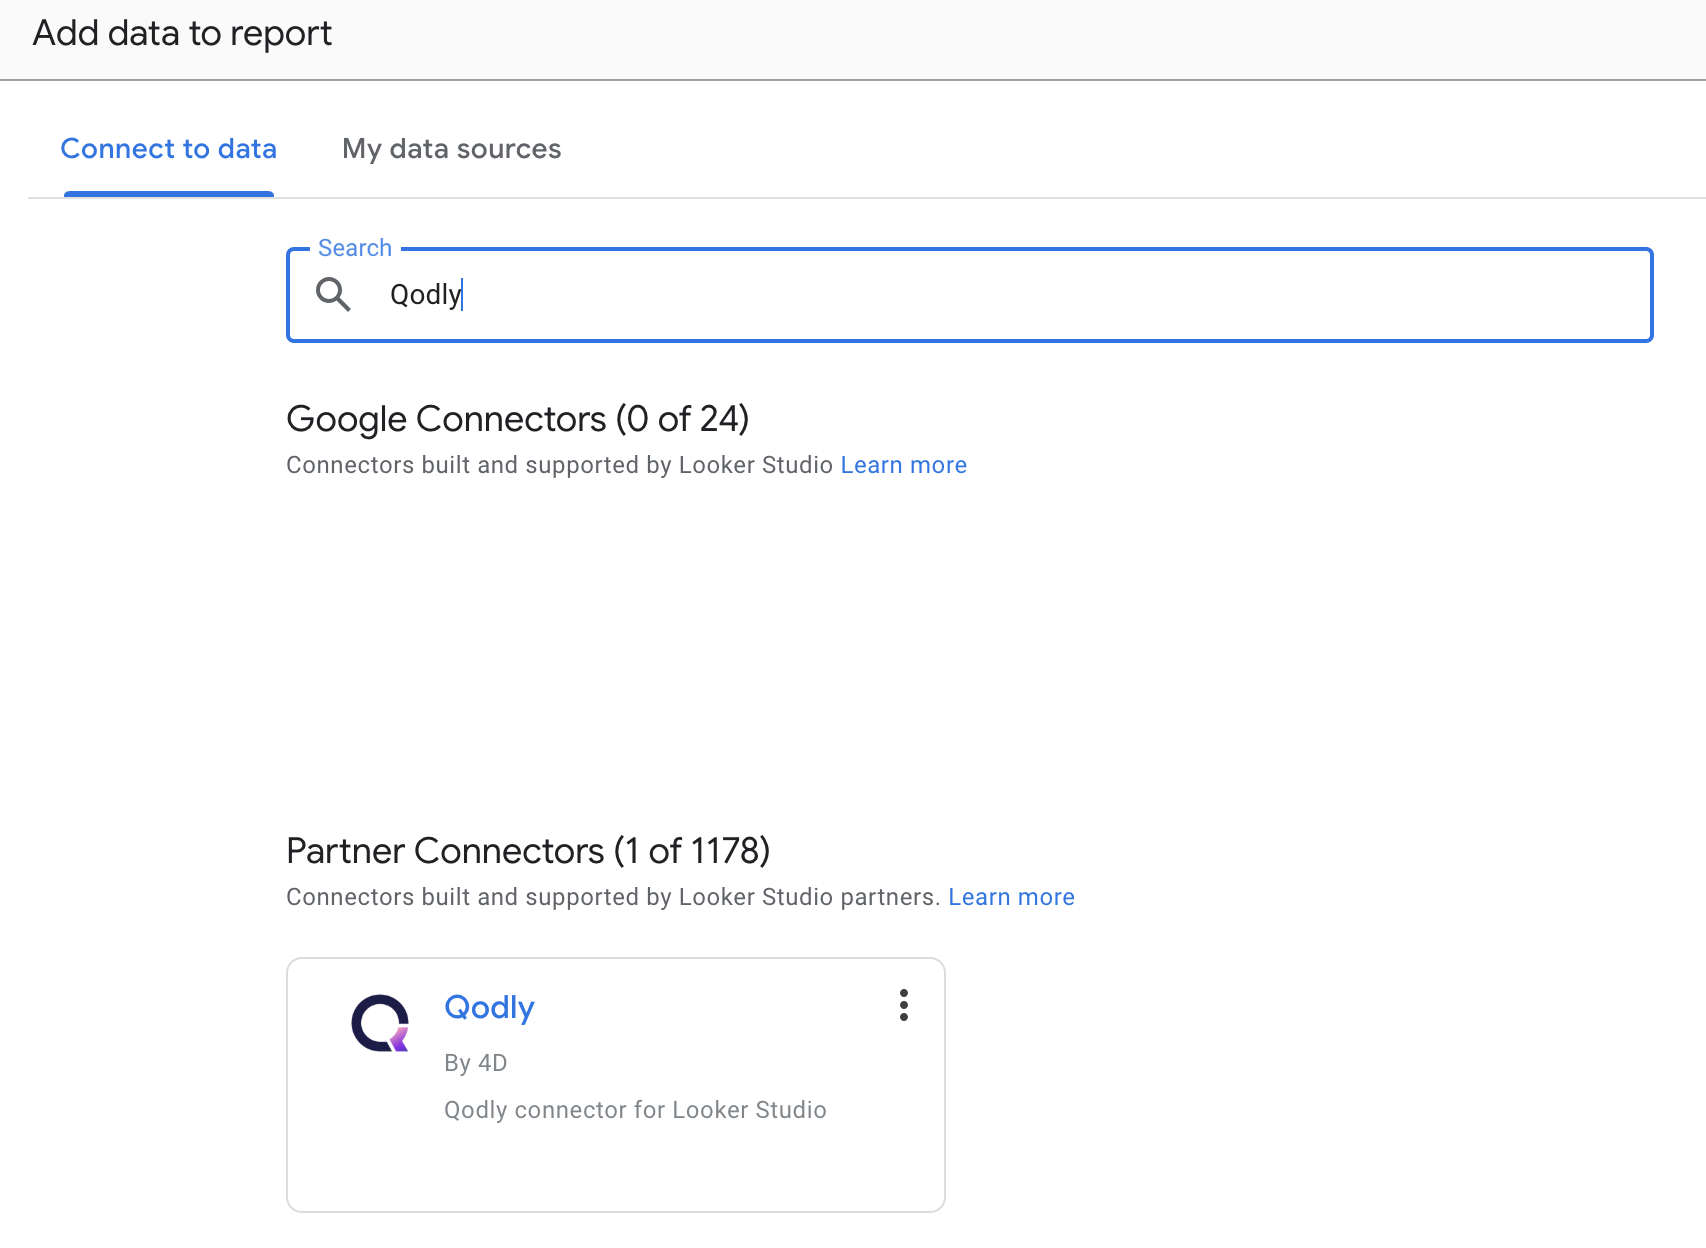
Search for the Qodly Partner Connector:
- In the search bar, search for "Qodly".
- It will be displayed under the Partner Connector section.
- Click on the Qodly connector to proceed.
-
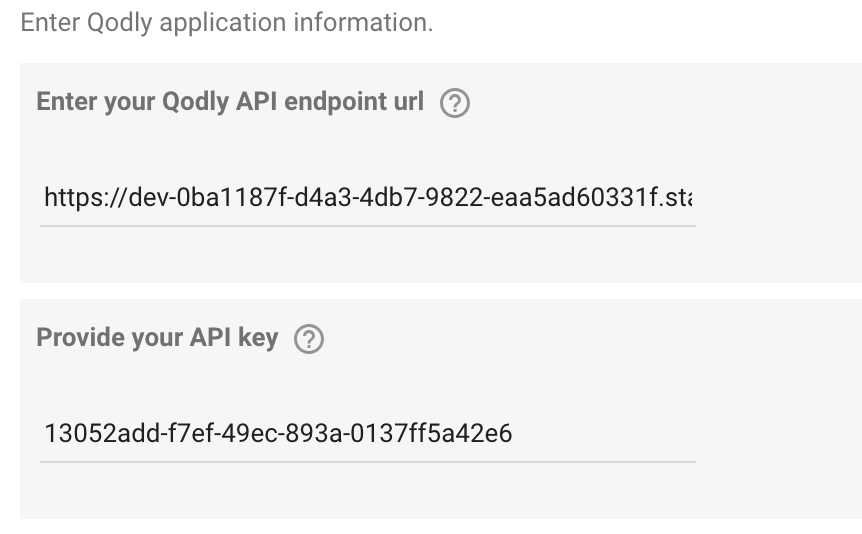
Enter Your API Credentials:
- Looker Studio will ask for the API Endpoint and API Key that you retrieved earlier.
- Paste them in the respective fields.
- Click Next to continue to the configuration screen.
-
Verify the Connection:
- Once the connection is established, Looker Studio will list the available data classes from your Qodly application.
- If the connection fails, ensure that the API key is correct and that your Qodly app allows external API access.
Now that your Qodly data is connected to Looker Studio, you can start building reports and visualizing your business data.
Configure the Data Configuration Settings
Once your Qodly Looker Studio Connector is connected, you need to configure key settings to ensure efficient data retrieval and proper visualization in Looker Studio. These settings define how your data will be fetched and structured.
-
Enter a Dataclass Name:
- Example Value: Order
- Explanation: This is the main data class you want to report on. Since we're analyzing customer orders, Order is the logical choice. Looker Studio will use this class to fetch and structure the data shown in your report.
-
Enter a Dataclass Attribute (of type date) to be used by Looker Studio as the main date range:
- Example Value: date
- Explanation: This setting determines the primary date field used for filtering reports. In this case, date represents the order date, which is the most logical date for tracking transactions over time. When you apply a date range filter in Looker Studio (e.g., “Last 30 days”), this is the field it will use.
-
Pagination Top:
- Default Value: 10000
- Explanation: Sets the number of records fetched per API request. A higher value means fewer API calls but can slow down performance if you're dealing with a lot of data.
-
Cache TTL (Time-To-Live):
- Default Value: 900 (in seconds)
- Explanation: This setting controls how long the connector reuses previous query results before sending the same query to Qodly again. It's part of the connector’s internal cache (not Looker Studio’s cache) and helps reduce unnecessary requests to Qodly.
- Use a lower value (e.g., 300) if your data changes frequently.
- Use a higher value (e.g., 3600) if your data is more static — this can improve performance and reduce load.
-
Custom Query Filter (Optional):
- Example Value: amount > 500
- Explanation: Allows you to filter the data before Looker Studio retrieves it. (Example: If you only want to analyze high-value customers, you can set a condition to exclude orders under $500.). You can also filter by country: country = 'USA' to analyze only US-based customers.
-
Add Additional Attributes to Query (such as relations):
- Example Value: customer.firstName, customer.lastName, customer.email, country, city, amount
- Explanation: This setting allows you to retrieve related fields from the Customer entity. Since customer is a relation in the Order table, you need to explicitly include attributes like customer.firstName, customer.lastName, and customer.email. Also, include country and city to analyze customer distribution geographically.
All Looker Studio partner connectors have a 6-minute timeout per query. If fetching data takes longer than that, the query will fail. Tuning Pagination Top, applying filters, and reducing data volume help ensure queries stay within that limit.
To avoid this:
- Lower the Pagination Top to reduce the load per request (e.g., try 5,000 or 2,000).
- Add filters in Looker Studio to limit how much data is being fetched.
- Narrow the date range if possible.
These adjustments can help keep data retrieval efficient and within the allowed time limit.
Click "Add" to apply the settings and fetch the data.
Creating Reports in Looker Studio
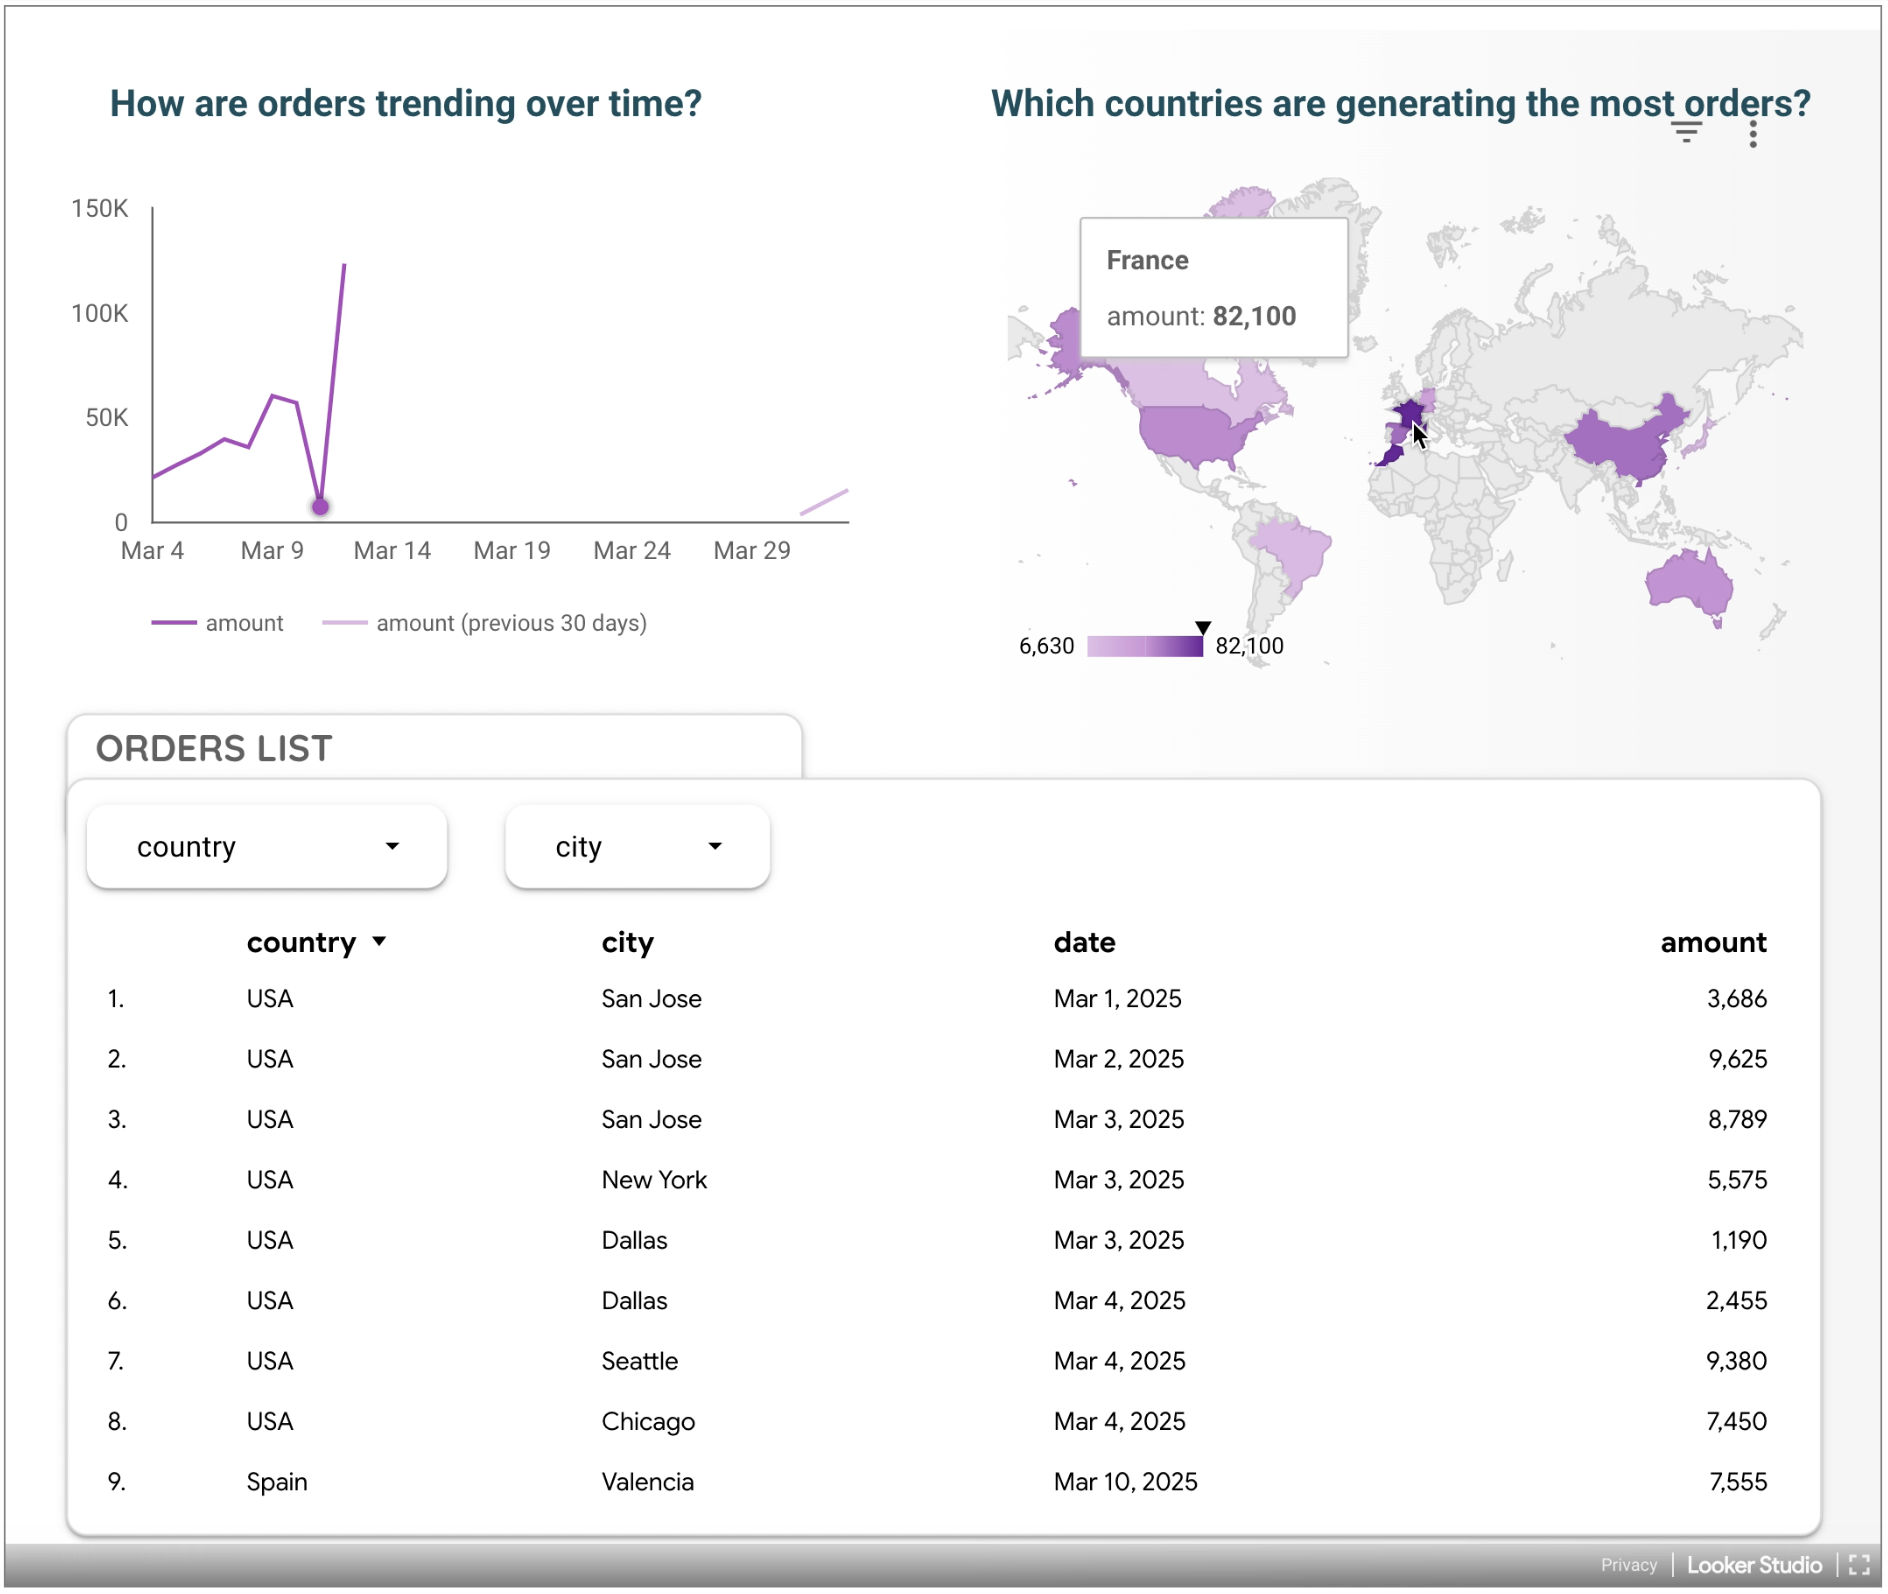
Now that the Qodly Looker Studio Connector is properly configured, you can create insightful reports using Looker Studio’s built-in visualization tools. Follow the steps below to add charts, configure data, add descriptive titles, and style your visualizations clearly and effectively.
Step 1: Add a Chart
In your Looker Studio report:
- Click the Add a chart button
 from the toolbar.
 - Choose your preferred chart type (e.g., Area Chart, Geo Chart, Time Series Chart, Bar Chart).
- Click or drag the chosen chart onto your report canvas.
Step 2: Configure Your Chart Data
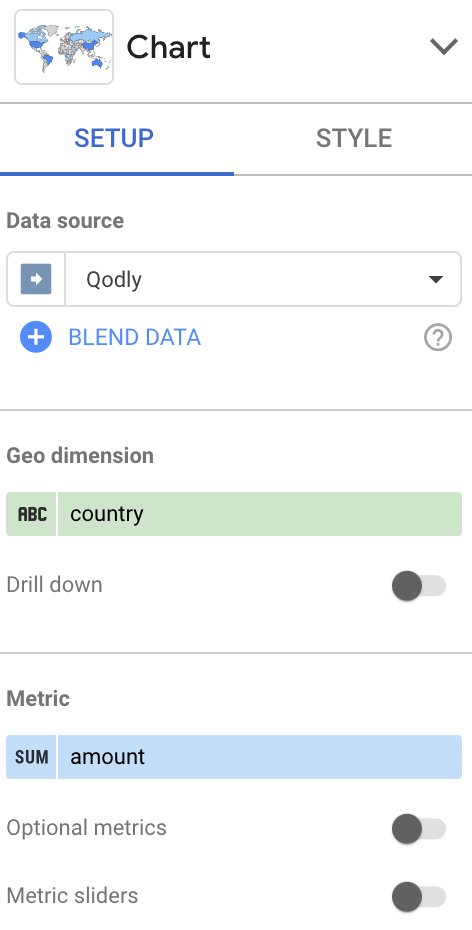
With your chart selected, use the Setup panel on the right side to configure your data:
- Data Source: Select your configured Qodly data source.
- Dimension: Choose a categorical or date-based field (e.g., date, country, city).
- Metric: Select the numeric measure to visualize (e.g., amount, orderCount).
You may add optional filters or comparison dates to further refine your visualization.
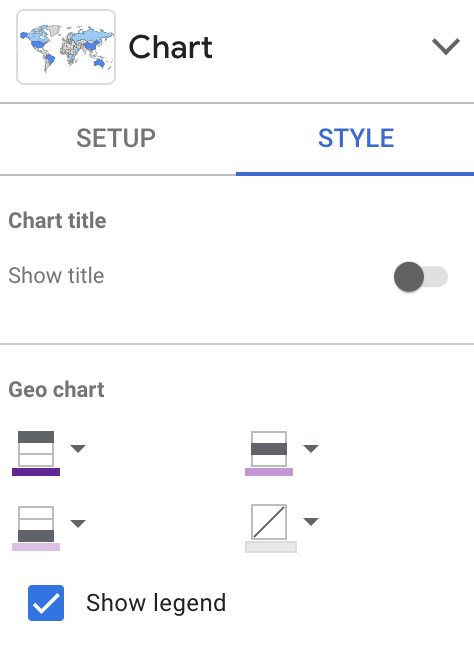
Step 3: Customize Chart Appearance
Enhance readability and visual appeal:
- Select your chart and click the Style tab in the right panel.
- Adjust color schemes, font styles, line thicknesses, and background colors.
- For maps, configure color gradients to effectively highlight differences in data values.
- Enable or disable legends, axis labels, and tooltips as needed to simplify interpretation.
For detailed guidance and advanced configuration options for different types of charts, refer to the official Looker Studio documentation Chart references.
Embedding Looker Studio Reports in Qodly
To embed Looker Studio reports directly into your Qodly application, you'll need to use the IFrame custom component. An iframe represents a nested browsing context, allowing another HTML page to be displayed seamlessly within your Qodly app page.
Step 1: Install the IFrame Custom Component
You can obtain the IFrame custom component directly from the Custom Components list for Qodly Studio in GitHub:
- Navigate to the IFrame custom component repository.
- Download the latest release (qodly_IFrame_version.zip) from the Releases page.
Once downloaded, follow these steps:
- Open Qodly Studio.
- Locate and click the dedicated Upload button in the Component bar.
- Upload the downloaded qodly_IFrame_version.zip file.
- Install the custom component when prompted.
After successful installation, refresh your Qodly Studio page. The new IFrame component will now appear in your components bar, ready for drag-and-drop onto your canvas.
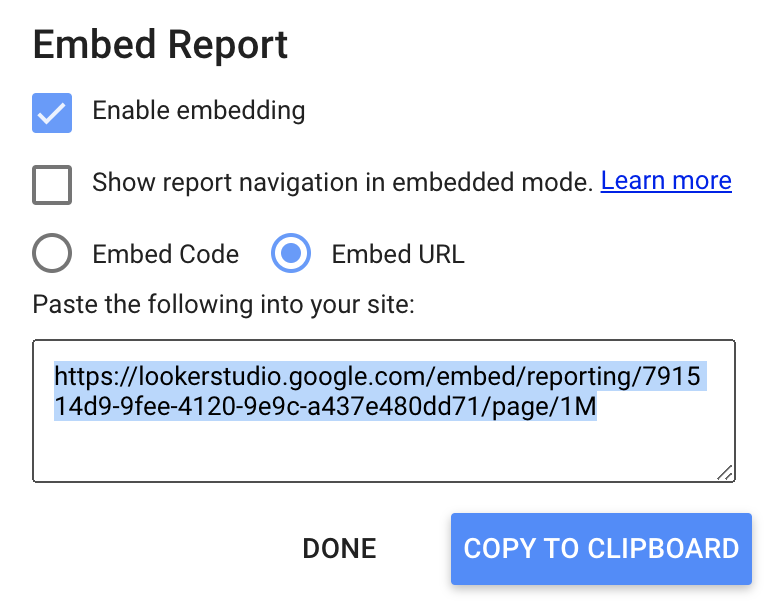
Step 2: Get the Looker Studio Embed URL
In Looker Studio, open your desired report:
- Click Share
 , then select Embed report
  .
.
- Ensure "embed URL" is checked, then copy the provided link.
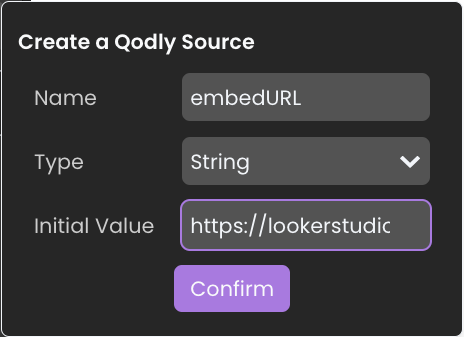
Step 3: Embed the Report into Qodly
Return to your Qodly app page in Qodly Studio.
- Create a new Qodly source of type String.
- Set the copied Looker Studio Embed URL as the default value for this source.
- Drag the newly installed IFrame component onto your canvas.
- Assign the Qodly source (containing the embed URL) to the IFrame component.
- Adjust the iframe dimensions to 600x450 pixels (or as needed).
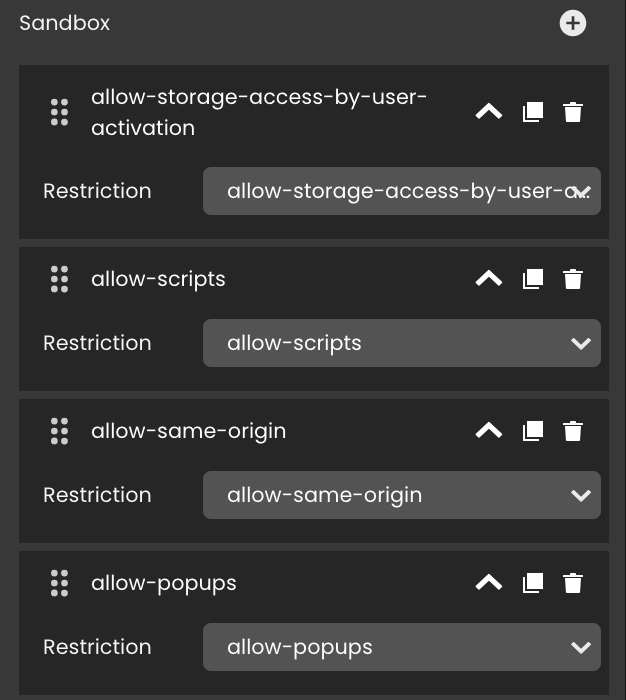
Step 4: Configure Sandbox Settings
The IFrame custom component uses sandbox attributes to apply security restrictions to embedded content. To ensure your embedded Looker Studio report displays correctly, you must include appropriate sandbox attributes. Without these attributes, your report might not render or function properly.
- allow-storage-access-by-user-activation: Experimental—enables embedded pages to request access to cookies via the Storage Access API.
- allow-scripts: Permits embedded pages to execute JavaScript (but not pop-up windows).
- allow-same-origin: If omitted, the embedded page is treated as from a unique origin, restricting certain browser functionalities.
- allow-popups: Allows pop-up windows (e.g., via window.open()).
Conclusion
Now you're ready to see your report directly embedded within your Qodly application.
Google API Disclosure
Ensure you regularly review permissions and access settings for your embedded reports, especially if sensitive business information is displayed. Keeping your embedded content secure and up-to-date helps maintain overall application integrity and performance.
Qodly Looker Studio connector adheres to the Google API Services User Data Policy while using and transferring information received from Google APIs to other applications, including Google’s Limited Use requirements. You can revoke Qodly Looker Studio connector right to access your data at any point from your Google account control panel (https://security.google.com/settings/security/permissions).