Resource Monitoring
Overview
Each application environment is an isolated instance in which you can configure specific resources and settings tailored to different stages of development.
General Tab
The General Tab contains core information and key actions, providing an at-a-glance view of the environment's current state.
Environment Info

1. Usage:
The Usage card contains:
- Disk Usage: Shows the percentage of disk storage currently used by the environment, useful for tracking storage limits and understanding data volume.
- Memory Usage: Displays the memory consumption percentage, allowing you to monitor memory use and scale resources as needed.

2. Users:
The Users card indicates the number of users with access to this environment.

3. Server Status:
The Server Status card contains:
- Status: Whether the server is operational and accessible.
- Control Buttons:
- Stop: Stops the server, making it unavailable temporarily.
- Restart: Restarts the server, which can be useful for troubleshooting or applying configurations.
- Refresh: Updates the server status display, allowing you to check the latest status.

Application Access
This section provides links for accessing the application through different URLs, depending on the environment's authentication and access configuration:

1. Studio URL:
Qodly Studio URL directs to the environment directly in Qodly Studio, where you can develop and configure the application. You can either open this in a new tab or copy the URL.

2. Authenticated URL:
The Authenticated URL directs to a login-protected version of the application, where only users in the application’s user registry have access. This link ensures that only authorized users can access this environment securely. You can either open this in a new tab or copy the URL.

3. Public URL (Development Environment Only):
The Authenticated URL provides a publicly accessible URL, allowing anyone to access the application without authentication. This is useful for exposing specific pages to the public or setting up custom login management.

-
Activate Public Access: Click to enable public access. A confirmation dialog will appear to verify your choice.
-
Deactivate Public Access: Click to remove public access, making the environment private again.
-
Copy Link: Copies the URL for easy sharing.
noteBy default, the public URL is disabled. You can Activate public access to make the environment publicly accessible, suitable for applications that don't require authentication for end users.
4. Custom Domain (Deployment Environment Only):
Allows you to use a custom domain for the application in deployment environments (such as Staging or Production) to create a professional, branded experience.

- Add Custom Domain:
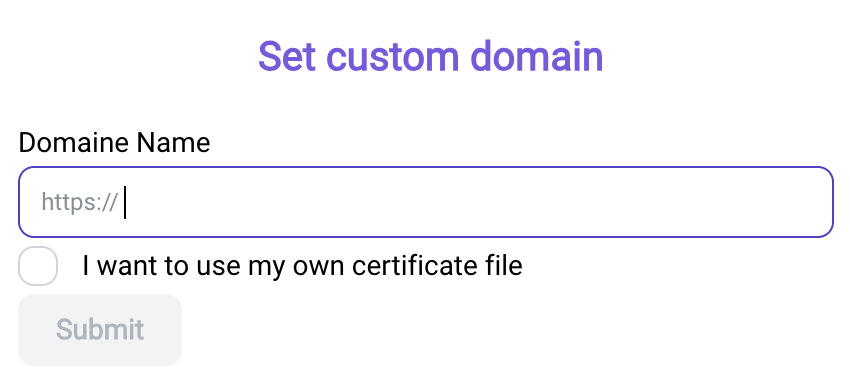
- Click the Add Custom Domain button, which opens a dialog for setting up your custom domain.
- In the Set Custom Domain dialog, enter your domain name.

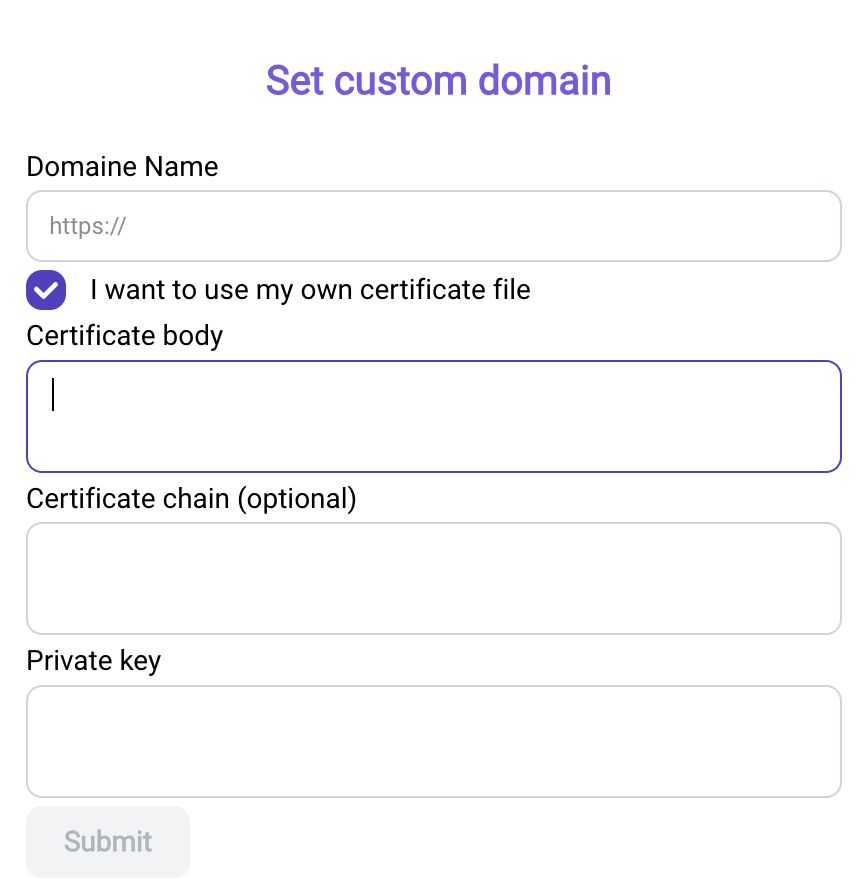
- Using Your Own SSL Certificate: For enhanced security, you can add a custom SSL certificate by selecting "I want to use my own certificate file," which opens fields to enter.
- Certificate Body: Paste the content of your SSL certificate.
- Certificate Chain (optional): Provide the certificate chain if required by your SSL provider.
- Private Key: Input the private key associated with your certificate.

Activity
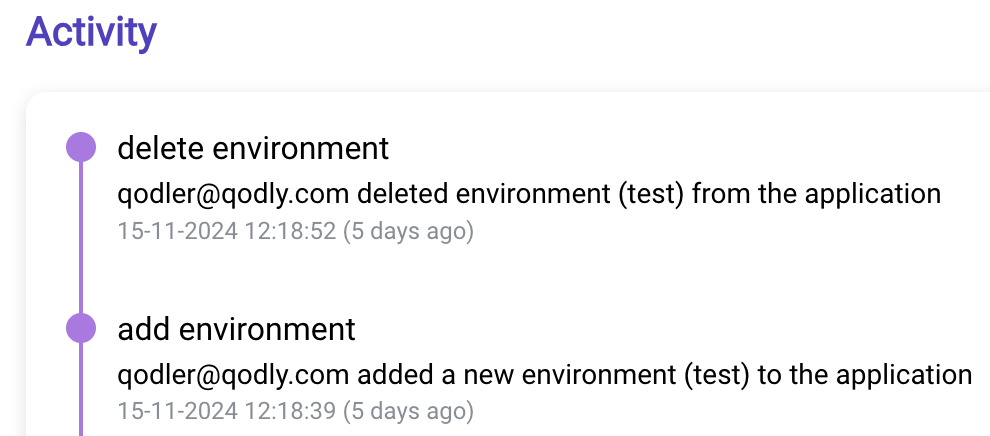
The Activity section logs significant events and actions taken within the environment, offering an audit trail for tracking changes. Typical entries include:
- Create Application: Logs the creation of the environment.
- Server Actions: Logs actions like server start, stop, or restart.
- Updates: Tracks version updates and configuration changes.
Each activity entry includes:
- Description: Summarizes the action taken (e.g., server start).
- Timestamp: Provides the date and time the action occurred.
- User: Indicates which user performed the action.

Metrics Tab
In the Metrics tab, you have access to detailed monitoring graphs for various performance metrics in your application environment. This tab allows you to visualize resource consumption over time, enabling effective tracking and optimization.
At the top of the Metrics tab, there is a date range selector where you can specify the time period you want to analyze. The refresh button allows you to reload the metrics for the most up-to-date data. Also, each graph includes an export icon, allowing you to save the graph as an image. This feature is helpful for reporting or further analysis outside the Console.
CPU Usage (%)
This chart displays the percentage of CPU capacity utilized by the application over a selected time period. It helps you identify peaks in CPU demand, allowing you to understand processing load and optimize your application’s performance accordingly.
Memory Usage (%)
The memory usage graph shows the percentage of RAM currently being used by the application. Monitoring memory helps ensure your application has sufficient resources and can inform you if additional memory allocation is needed.
Disk Usage (%)
This metric illustrates the percentage of disk storage currently occupied. Disk usage monitoring is crucial for applications with large datasets or significant storage requirements.
Network RX IN (Bytes)
Network RX IN shows the incoming data received by your environment, measured in bytes. This metric is useful for tracking inbound data, which can help identify if your application is receiving high volumes of data at any given time.
Network TX OUT (Bytes)
Network TX OUT displays the outgoing data transmitted from your environment. This metric is essential for monitoring outbound data usage, particularly if your application regularly sends data to external sources.
Network Transmitted (Kilobytes)
This metric indicates the total data transmitted over the network, aggregated over time in kilobytes. It provides a broader view of your network usage, helping you manage data transmission and avoid potential network bottlenecks.
Logs Tab
The Logs Tab in the Console provides access to detailed log records for monitoring, debugging, and tracking system events within your application environments. This tab allows you to filter and download logs based on a specific date range and log file type.
The Date Range Selection feature allows you to filter log entries to a specific period:
-
Start Date: Select the beginning date and time for the logs you want to view.
-
End Date: Select the ending date and time for the logs.
Using the date range filter helps focus on specific periods, which is especially helpful when investigating incidents or tracking performance over time.
Log File Type
This section provides a drop-down menu where you can select the type of logs to view. The available log types include:
-
qodlySTDOUTLog: Contains standard output logs from the application, capturing routine system and application messages.
-
4DDiagnosticLogServer: Includes diagnostic data related to server performance and behavior, useful for more technical troubleshooting and server analysis.
You can write custom information in the diagnostic log file thanks to the logEvent() command.
Once you select a log type, click Refresh to update the log data based on the selected type and date range.
The Refresh Button updates the log display with the latest entries that match your selected date range and log type. This is especially useful after changing filters or when logs are dynamically updated during active monitoring.
Log Entries Display
The Log Entries Display shows a list of log events that match your selected filters. Each entry contains:
- Date: The date and time of the log event.
- Log Details: Describes the event or action, including any associated identifiers, error messages, and user actions. Like:
INFO - New user connected: Indicates a successful user connection to the system, along with specific identifiers like task ID and hostname.ERROR - cannot create socket: Shows an error with details on the task attempting the action, which helps in diagnosing network or socket issues.
Downloading Logs
The Download Button enables you to export the filtered log entries:
-
After specifying the date range and log type, click Download to save the log data as a file.
-
This file is useful for offline analysis, reporting, or archiving log data for future reference.